
 Facebook
 X
 Pinterest
 Copy Link


Fewer sales, a higher median price—and a closer look at resale homes
September’s San Marcos housing numbers tell two different stories: fewer single-family homes
closed, while the median sale price rose. For buyers, it is a reason to compare options carefully.
For sellers, a higher citywide median does not automatically mean every home is worth more.
This update covers single-family homes in the City of San Marcos within Hays County, including new construction and
resale. Condos, townhomes and manufactured homes are excluded.
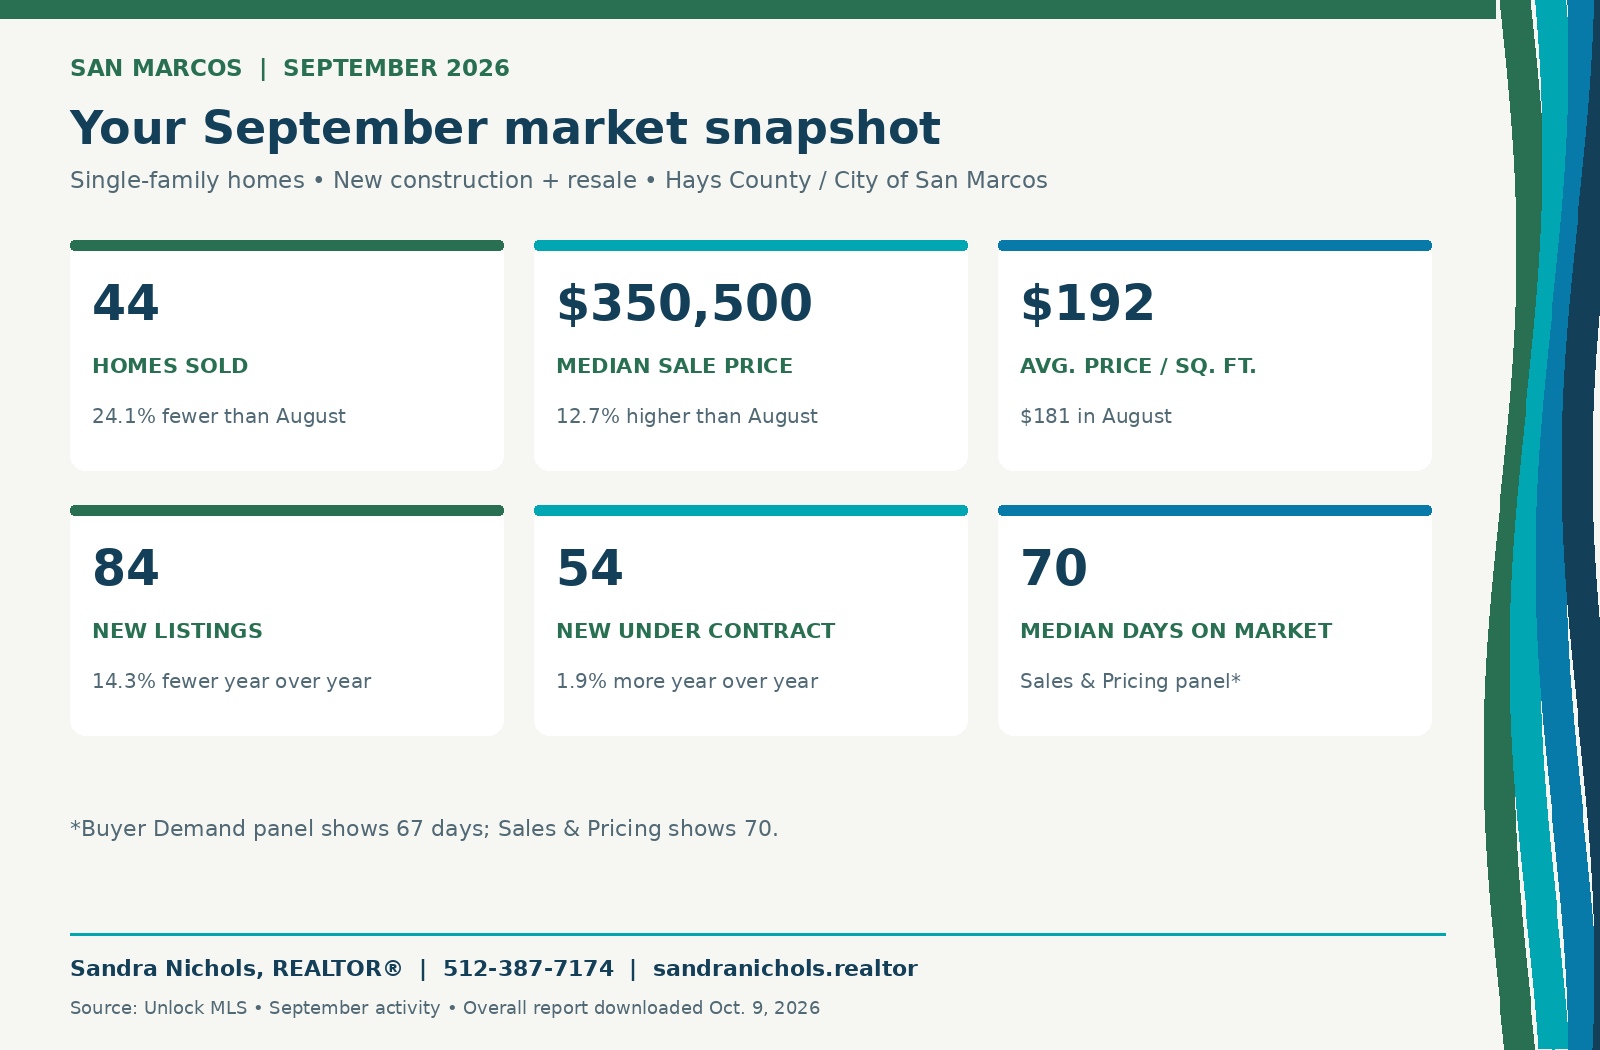
September’s numbers at a glance
September recorded 44 home sales, compared with 58 in August—a decrease of 24.1%. Sales were also down 29.0% compared with September 2025.
The median sale price increased to $350,500, up 12.7% from August and 6.2% from a year earlier. The average sale price was $430,636, while the average price per square foot was $192.
There were 84 new listings and 54 homes newly under contract during September. Although fewer homes closed, buyers were still making purchasing decisions.
Why a higher median doesn’t mean every home gained value
The median sale price is the midpoint of the homes that sold. It can change depending on the size, location and price range of those homes.
New construction made up a smaller share of September’s closings than August’s in the combined report. Because the new-construction segment had a lower median sale price, that change in the mix may have contributed to September’s higher overall median.
For an individual home, recent comparable sales remain more useful than the citywide median.
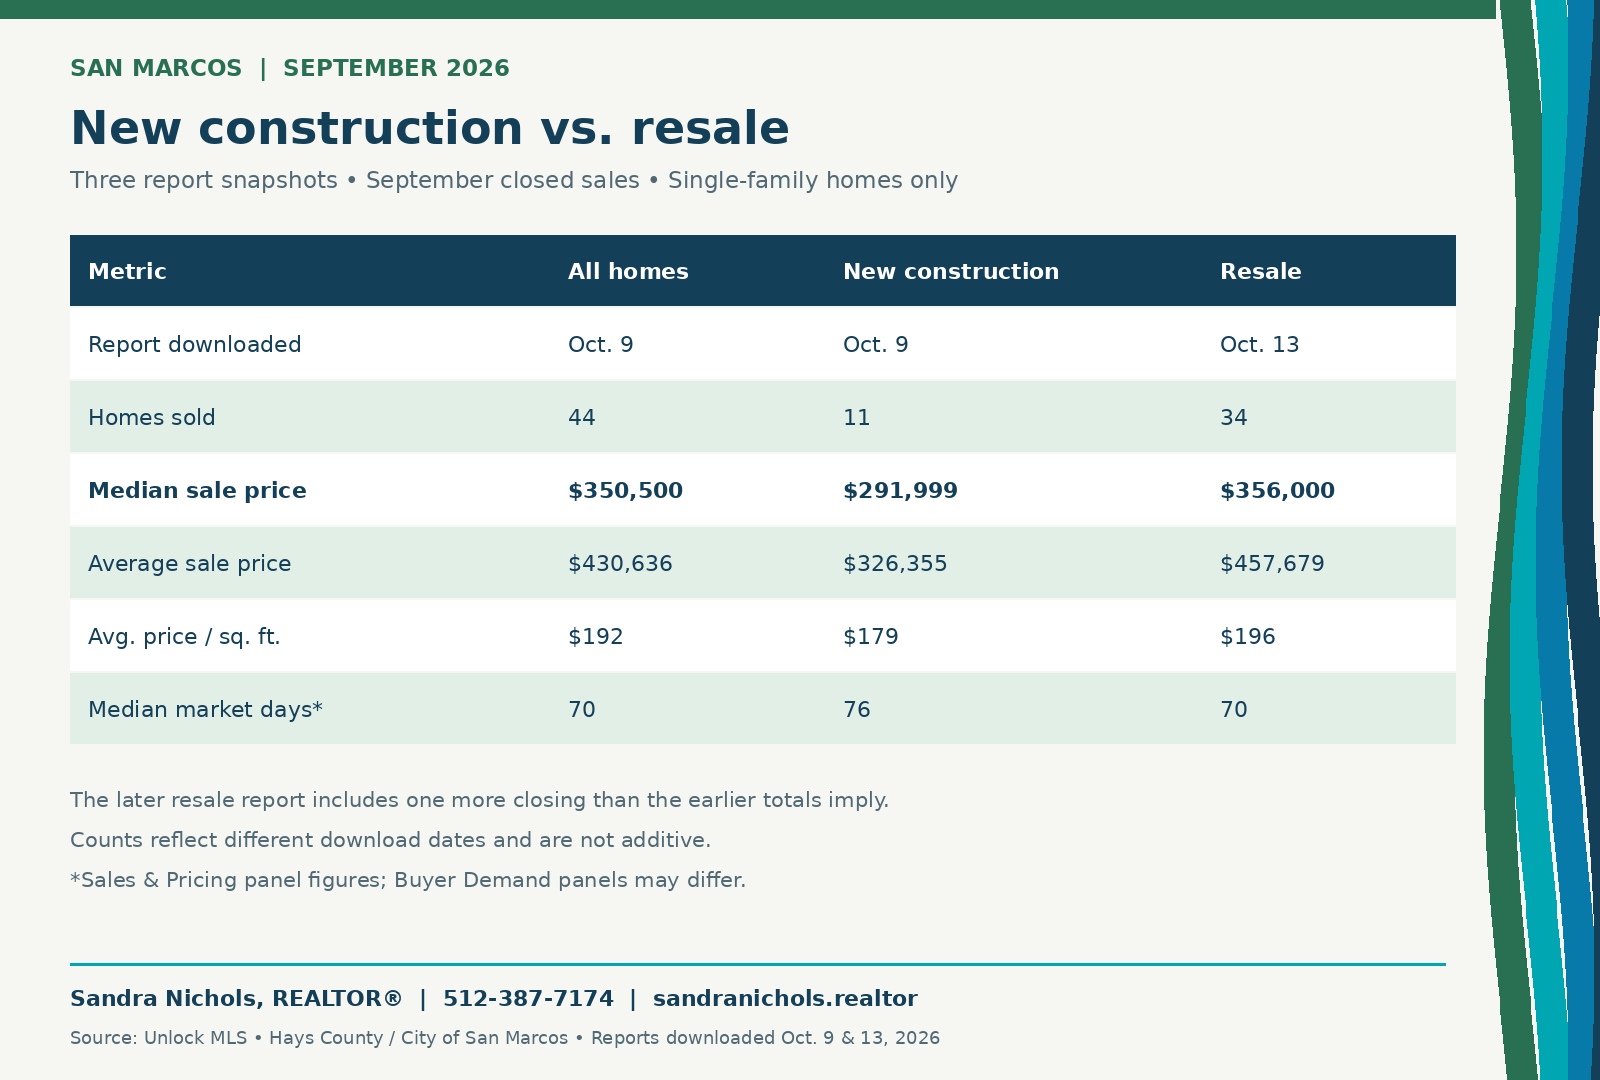
New construction and resale tell different stories
The resale-only report showed 34 September closings with a median sale price of $356,000. Resale sales were down 8.1% compared with September 2025, while the median price rose 9.6%. The average resale sale price was $457,679.
New construction recorded 11 closings with a median sale price of $291,999 and an average sale price of $326,355. New-construction sales were down 56.0% year over year, and the median price was down 13.6%.
These figures reflect different types of homes. Size, neighborhood, lot, finishes and the particular homes that closed all affect the results. A new home is not automatically less expensive than a comparable resale home.
Price reductions remain part of the picture
Of the 44 homes that closed in the combined September report, 31 had a price reduction—about 70%. Among new-construction closings, 10 of 11 had a reduction.
These figures describe homes that sold, rather than all homes currently listed. For sellers, they reinforce the importance of pricing competitively from the beginning. For buyers, they show why reviewing a home’s pricing history can be helpful when preparing an offer.
Seller concessions and builder incentives also deserve attention. A contribution toward closing costs or an interest-rate buydown can affect affordability differently than a price reduction.
What this means for buyers
Compare resale homes and new construction side by side, looking beyond the advertised price. Consider condition, location, lot size, completion timing and any verified financing incentives or seller concessions.
With 54 homes newly under contract during September, buyers are still active. A well-priced home that fits your needs deserves attention even when overall sales have slowed.
What this means for sellers
Price your home against recent comparable sales and today’s competition. September’s higher median is encouraging, but it is not a reason by itself to increase your asking price.
Resale sellers should also consider nearby builder offerings. Strong presentation, good condition, effective marketing and a thoughtful concession strategy can help buyers recognize your home’s value.
If showings or offers are limited, review feedback and pricing early.
How much inventory is available?
As of October 9, the combined report showed 361 active single-family listings, including 86 new-construction homes. The October 13 resale report showed 270 active resale listings.
These figures reflect availability on their respective report dates, rather than September 30 inventory. Your choices—and your competition—will vary by neighborhood and price range.
Let’s put the numbers to work for your move
Whether you are buying or selling in San Marcos, the most useful numbers are the ones that apply to your neighborhood, price range and home. I can help you compare recent sales, current listings and new-construction options to build a plan for your next move.
Sandra Nichols, REALTOR®
Century 21 Randall Morris & Associates
512-387-7174
https://sandranichols.realtor/
Results that move you.
Source: Unlock MLS Residential Market Snapshot. Combined and new-construction reports downloaded October 9, 2026; resale report downloaded October 13, 2026. September activity covers single-family homes in San Marcos within Hays County. MLS data may be revised.


